Let your data tell the story
- Brandon Sodenkamp
- Mar 21, 2019
- 2 min read
From the moment data is first collected, it can be difficult to understand and interpret it. Traditionally, you as a decision-maker have needed to rely on the interpretations of scientists and other domain experts. The fact is that the only ones with the ability to really work with the data are not usually the end user of that data in a company. The Javascript world has tried to make interpretation easier by applying the ideas of Bret Victor. The concept he amplified is to make the data and documents interactive, enabling the user to come to their own conclusions. The difficulty, however, continues to be how exactly to implement this in a way that can be maintained and integrated into other solutions. Grant Nestor (a software engineer at Quansight) has taken on the challenge of bringing more interactive documents and data into the Python world.

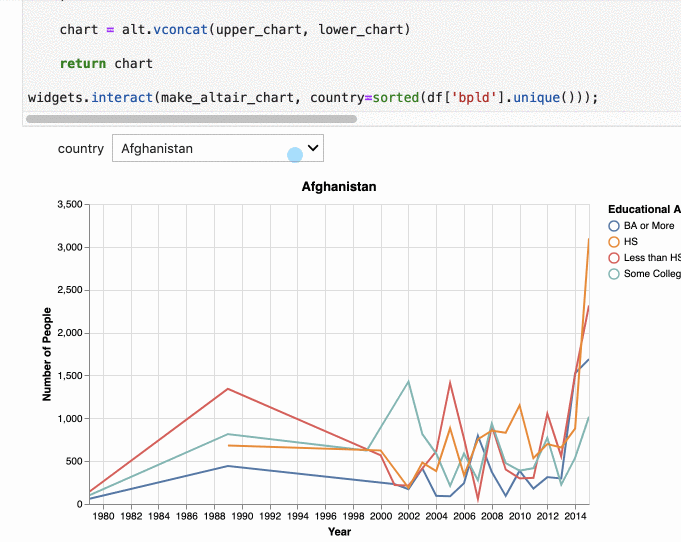
Utilizing Jupyter and the vdom Python library, Grant was able to easily recreate elements from Victor’s Tangle library in pure Python. Vdom is a project from the nteract community that allows Python users to declaratively create UI using functions vs. the traditional and much less ergonomic method of passing strings to IPython’s HTML display class. On the front-end, vdom uses React to render these virtual DOM objects so it benefits from React’s DOM reconciliation optimizations. Grant has recently added event handling support to vdom, allowing users to not just render data using vdom but also interact with it. When these explorations are completed, the data science community will have a whole new arsenal of interactivity at their disposal!
Grant’s work represents some of the most cutting-edge developments in the vdom project and he continues to push its boundaries daily. Ipywidgets is another Python library that allows users to visualize and interact with data using widgets or UI elements like inputs and sliders. The primary difference between ipywidgets and interactive VDOM is it’s developer experience. Ipywidgets provides many useful widgets out-of-the-box but custom widgets require users to write implementations for both the front-end (Javascript) and back-end (Python) and install a front-end extension (e.g. JupyterLab extension). Grant has recently demonstrated how vdom can render React components (dynamically imported from npm) in addition to native HTML elements which allows users to declare complex UIs entirely from the notebook!

Grant’s event handling work has already been merged into vdom and is waiting to be merged into JupyterLab. You can try it out now on mybinder (event handling demo, React component demo, and Tangle demo coming soon). If you are interested in helping with this effort, you can reach out to Grant on GitHub. Interactive VDOM is already being used to facilitate real-time interactions within OmniSci’s GPU-accelerated analytics. The excitement for this work is building, so keep a lookout for new developments as they arrive later on this year!


Comments